
HTML5 Canvas and a Horace Dediu-esque Chart
A few months back, I came across this chart illustrating Apple's segment revenues on Reddit:
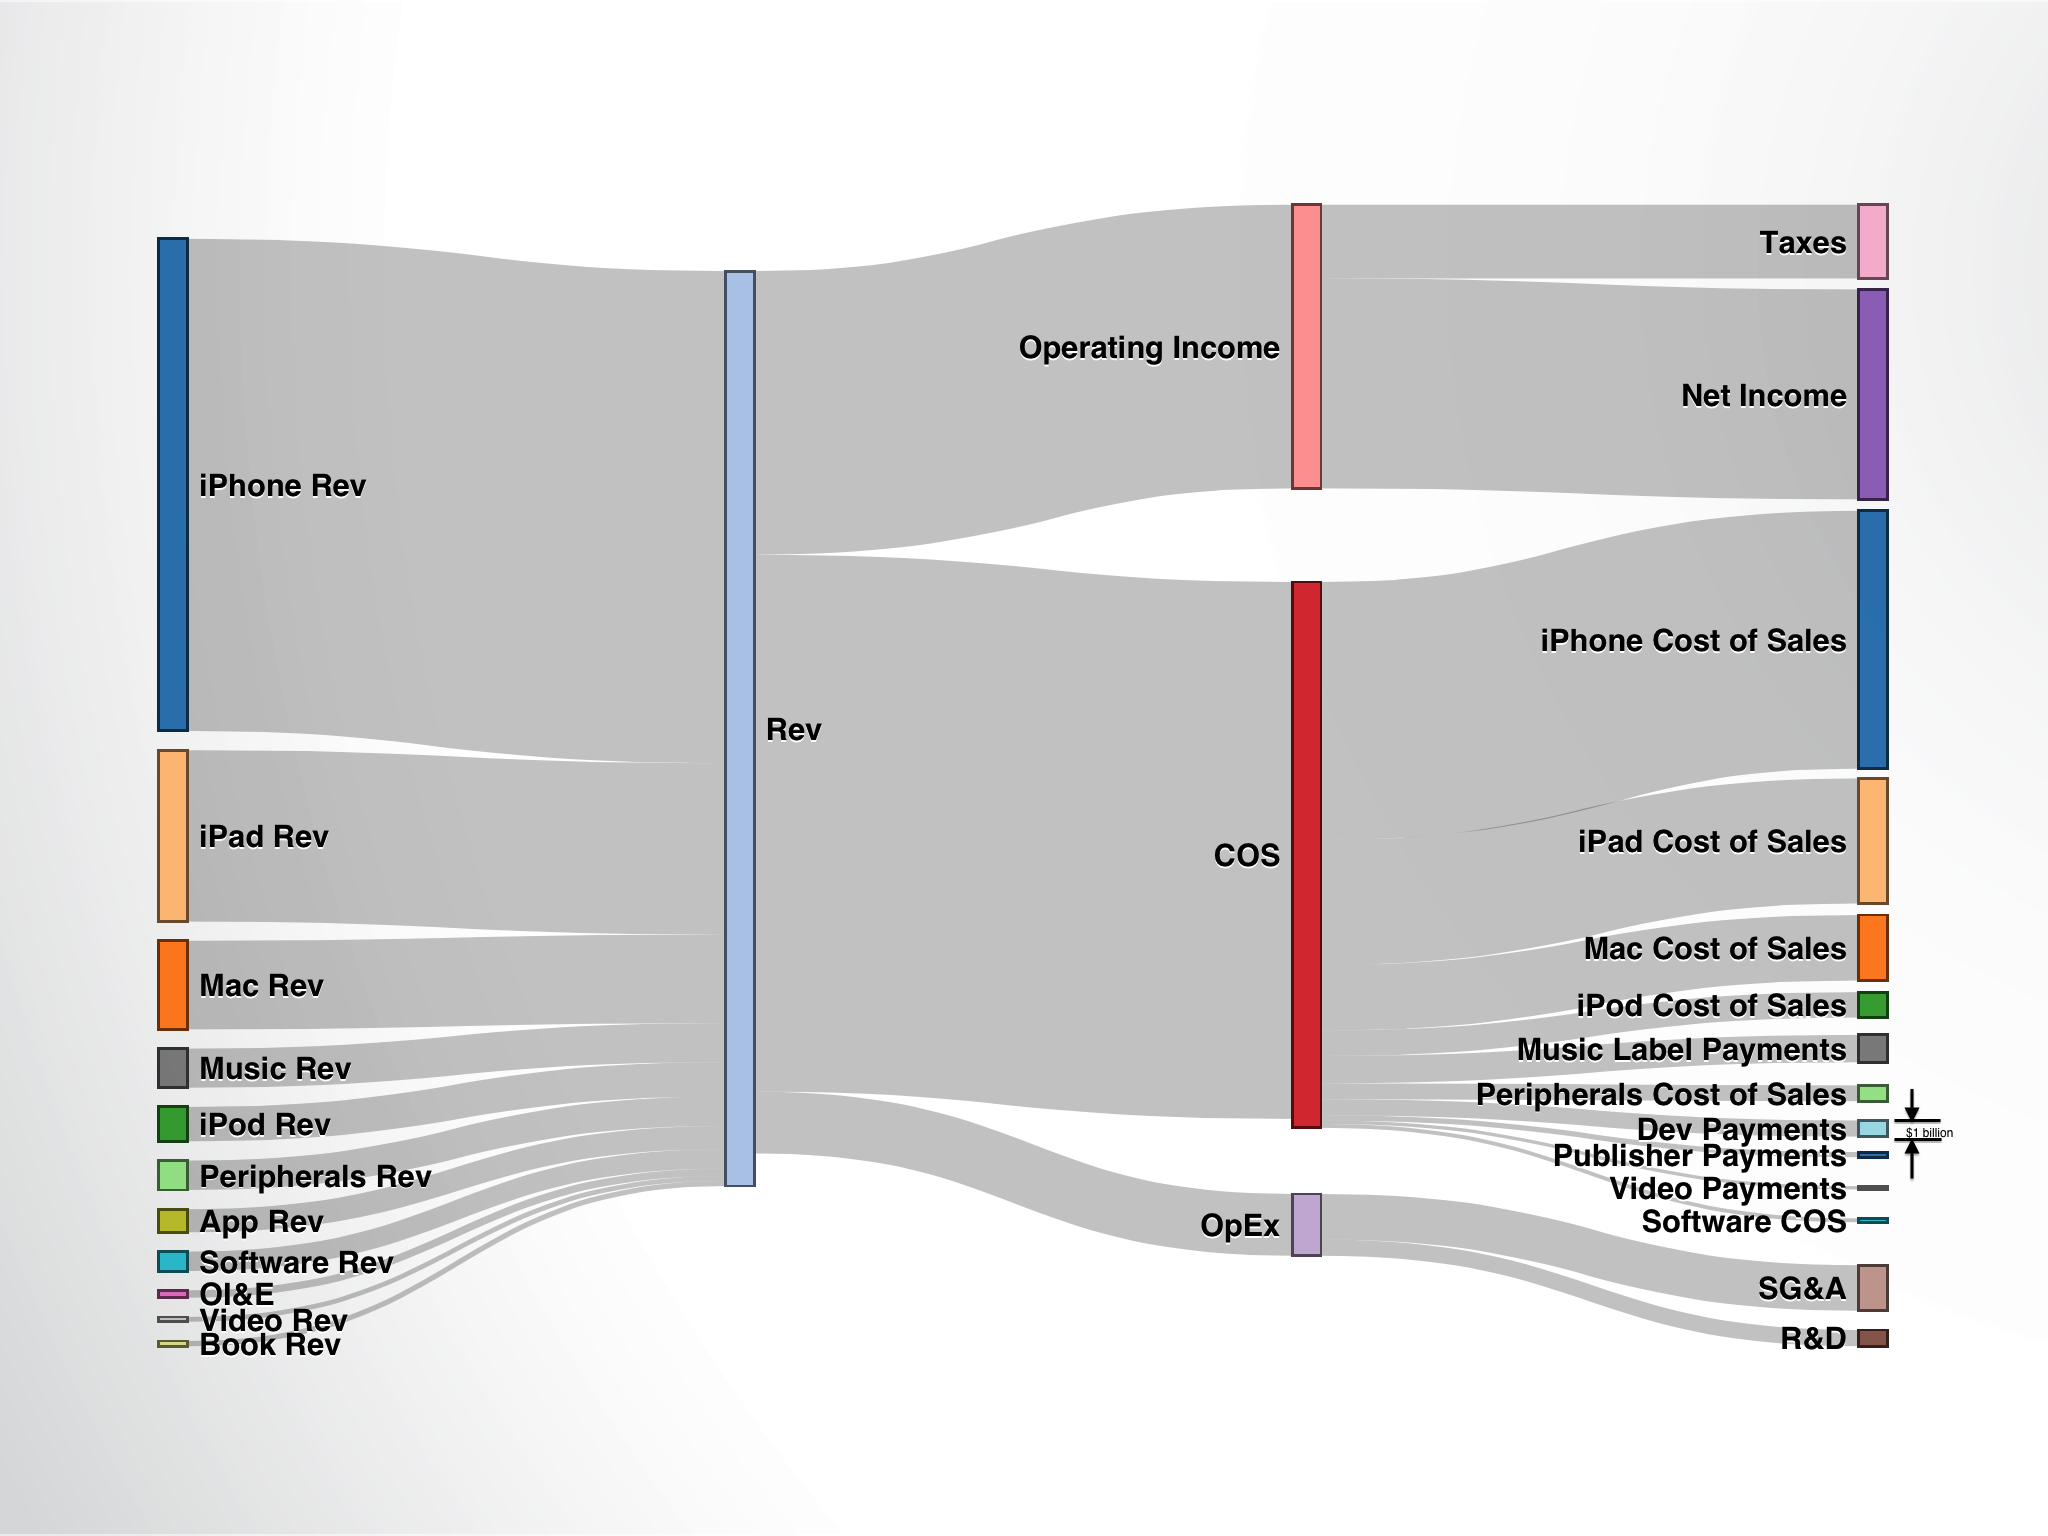
This is a great chart because it has impact with just a glance, and yet yields more solid data the longer you examine it. Ever since I saw this chart I wanted to build my own for my department, for startups, and offer it up to anyone else who might want to build a similar chart.
Horace Dediu of Asymco.com put this together using a chart-building iPad app called Perspective. Now, I should have just downloaded the damn app and made some similar charts and been happy. Instead I built my own from scratch using HTML5's canvas tag. Check out the demo.
In case you didn't notice it right away (I didn't either), Horace Dediu's chart uses the same colors to represent both a product's revenues as well as their cost of goods sold, giving you an at-a-glance idea of what a product's margin is. I replicated this feature in my tool as well.
Instead of a long-winded walk through of how I built the tool, I'm just going to share the source here and add some extra commenting for clarity.
<html>
  <head>
  <title>Finance Chart</title>
    <style>
      body {
        margin: 20px;
        padding: 20px;
      }
    </style>
  </head>
  <body>
  <!-- A basic HTML form for getting custom inputs from users. All of these values will be sent as HTTP GET variables in the URL-->
  <!-- From there, the JavaScript will fetch these variables out of the URL-->
  <form method="GET" action="html5canvas.html">
    <label>Item 1 Label</label><input type="text" name="item1Label" /><br/>
    <label>Item 1 Revenues</label><input type="number" name="item1Rev" /><br/>
    <label>Item 1 COGS</label><input type="number" name="item1Cos" /><br/>
    <label>Item 2 Label</label><input type="text" name="item2Label" /><br/>
    <label>Item 2 Revenues</label><input type="number" name="item2Rev" /><br/>
    <label>Item 2 COGS</label><input type="number" name="item2Cos" /><br/>
    <label>Item 3 Label</label><input type="text" name="item3Label" /><br/>
    <label>Item 3 Revenues</label><input type="number" name="item3Rev" /><br/>
    <label>Item 3 COGS</label><input type="number" name="item3Cos" /><br/>
    <label>Operating Expense</label><input type="number" name="opEx" /><br/>
    <label>Scale ($M, $k, etc)</label><input type="text" name="scaleLabel" /><br/>
    <input type="Submit" value="Submit" /><br/>
  </form>
  <!-- The canvas tag - the only important thing here is to set your width and height as necessary-->
    <canvas id="myCanvas" width="1000" height="1200"></canvas>
  <script>
  // A handy little function that I picked up at http://papermashup.com/read-url-get-variables-withjavascript/
  // The function simply parses a GET variable out of the URL using REGEX and returns it
  function getUrlVars() {
    var vars = {};
    var parts = window.location.href.replace(/[?&]+([^=&]+)=([^&]*)/gi, function(m,key,value) {
      vars[key] = value;
    });
    return vars;
  }
  </script>
    <script>
    // Grabbing all of the user form variables out of the URL. For integer values, we need to cast them as an int datatype
    // because by default, as part of the URL string, they exist as strings
    var item1Label  =(getUrlVars()["item1Label"]);
    var item1Rev  =parseInt((getUrlVars()["item1Rev"]));
    var item1Cos  =parseInt((getUrlVars()["item1Cos"]));

    var item2Label  =(getUrlVars()["item2Label"]);
    var item2Rev  =parseInt((getUrlVars()["item2Rev"]));
    var item2Cos  =parseInt((getUrlVars()["item2Cos"]));

    var item3Label  =(getUrlVars()["item3Label"]);
    var item3Rev  =parseInt((getUrlVars()["item3Rev"]));
    var item3Cos  =parseInt((getUrlVars()["item3Cos"]));

    var opExInput  =parseInt((getUrlVars()["opEx"]));

    var scaleLabelInput = (getUrlVars()["scaleLabel"]);

    // We calculate the total revenue right away. Total revenue should be the largest number in any practical use case
    // and we will use it to set the scale for all of the rest of the variables
    var totalRev   = item1Rev + item2Rev + item3Rev;

    // Calculate and set variables for scaling purposes
    var scaler = (Math.ceil(100/totalRev));
    var totalRevScaled = (scaler*totalRev);

    // Scale label that will be used later - a conversion on the size of the scale bar will happen at the time of drawing the scale
    var scaleValue = '= 10 ' + scaleLabelInput;

    // Scale all of the item revenue and cost of goods solds values, and set them to new variables (unnecessary artifact of old code)
    var revenueItem1  = scaler*item1Rev;
    var revenueItem2  = scaler*item2Rev;
    var revenueItem3  = scaler*item3Rev;
    // Enter all revenues into an array to iterate through later. Do the same for labels
    var revenues = new Array(revenueItem1,revenueItem2,revenueItem3);
    var revenuesLabels = new Array(item1Label,item2Label,item3Label);

    //more detailed level COGS variables
    var cosItem1  = scaler*item1Cos;
    var cosItem2  = scaler*item2Cos;
    var cosItem3  = scaler*item3Cos;
    var cosItems  = new Array(cosItem1,cosItem2,cosItem3);
    // This array is redundant with revenuesLabels, another artifact
    var cosItemsLabels = new Array(item1Label,item2Label,item3Label);

    // Set total COS, scale the Operating Expense value, and set operating income (aka net income in this case)
    // to total revenue minus all other costs and operating expense. We use scaled values in this case because
    // we don't actually care about the dollar value, just that the cart is proportionally correct
    var cos        = cosItem1+cosItem2+cosItem3;
    var opEx      = scaler*opExInput;
    var operatingIncome  = totalRevScaled - (cosItem1+cosItem2+cosItem3) - opEx;
    // Set an array to iterate through for expense categories
    var expenseCats = new Array(operatingIncome,cos,opEx);
    var expenseCatsLabels = new Array('Operating Income','COGS','Operating Expense');

    // generic canvas variable setting
    var canvas = document.getElementById('myCanvas');
    var context = canvas.getContext('2d');

    // Generic variables for storing location information - these will be used, incremented, and re-used to act as a "ceiling"
    // for the bars in the chart
    var globalVerticalAdjustment  = 30;
    var revenueVerticalAdjustment  = 50;

    // Generic color array for assigning different colors to all blocks
    var colors = new Array('black','orange','red','yellow','green','blue','purple','gray','white');
    var c = 0;

    // Begin "painting" revenue bars
    // Grab the number of items in the revenues array
    var length = revenues.length;

    //for debugging only
    //alert("revenues array has "+length+" items");

    for (var i = 0; i < length; i++) {
      //debugging code
      //for debugging only
      //alert("global vert adj"+globalVerticalAdjustment);
      //draw rectangle for revenue source
      context.beginPath();
      // Set the upper left top corner. We will always use 230 as the horizontal value so all of the bars align
      // globalVerticalAdjustment will be incremented each time we paint a bar. 20 represents the width of the bar
      // in pixels, and the last argument is the height of the bar
      context.rect(230, globalVerticalAdjustment, 20, (revenues[i]));
      // Set the color of the bar, and increment the color array for the next color selection
      context.fillStyle = colors[c];
      c++;
      context.fill();
      // Set line color and width, then paint
      context.lineWidth = 2;
      context.strokeStyle = 'black';
      context.stroke();

      // Set label for revenue sources
      context.textAlign = 'right';
      context.fillStyle = 'black';
      context.font = "14pt sans-serif";
      // Here we use the revenuesLabel array to get the correct item name, and then set it to a location to correspond
      // with the location of the bar
      context.fillText(revenuesLabels[i], 250, globalVerticalAdjustment-10);

      // If this is NOT the first iteration, then we need to account for the previous bars heights for spacing reasons
      if(i!=0){
        revenueVerticalAdjustment = (revenueVerticalAdjustment + revenues[i-1]);
        //for debugging only
        //alert("rev vertical adj = "+revenueVerticalAdjustment);
      }

      // Drawing the top lines that connect with the total revenue bar
      context.beginPath();
      context.moveTo(250, (globalVerticalAdjustment));
      // The curve is simply a line based on 4 points - the origin, which is set in the 'moveTo' function, two points that dictate
      // which direction to curve the line (they act almost like gravity wells, if that helps your understanding), and an ending
      // point for the line
      context.bezierCurveTo(260, revenueVerticalAdjustment, 380, revenueVerticalAdjustment, 420, revenueVerticalAdjustment);
      context.lineWidth = 1;
      context.strokeStyle = 'black';
      context.stroke();

      // Drawing bottom lines to connect with total revenue bar - same functions, just different arguments
      context.beginPath();
      context.moveTo(250, (globalVerticalAdjustment+revenues[i]));
      context.bezierCurveTo(260, revenueVerticalAdjustment+revenues[i], 380, revenueVerticalAdjustment+revenues[i], 420, revenueVerticalAdjustment+revenues[i]);
      context.lineWidth = 1;
      context.strokeStyle = 'black';
      context.stroke();

      globalVerticalAdjustment += (revenues[i] + 50);
    }

    //Draw vetical revenue bar here - here we don't need an iterative function, because there always be one and only one revenue line
    context.beginPath();
    context.rect(420, 50, 20, (totalRevScaled));
    context.fillStyle = colors[c];
    c++;
    context.fill();
    context.lineWidth = 2;
    context.strokeStyle = 'black';
    context.stroke();

    // Create the text label for the total revenue bar
    context.fillStyle = 'black';
    context.font = "14pt sans-serif";
    context.textAlign = 'left';
    context.fillText("Total Revenue", 380, 40);

    // Resetting generic variables for location informatino
    globalVerticalAdjustment    = 30;
    expenseCatVerticalAdjustment  = 50;

    length = expenseCats.length;

    //for debugging only
    //alert("expense category array has "+length+" items");

    for (var i = 0; i < length; i++) {
      //for debugging only
      //alert("global vert adj "+globalVerticalAdjustment);

      // Same set of functions as the revenues section - drawing rectangles in the same way, just with different values
      context.beginPath();
      context.rect(620, globalVerticalAdjustment, 20, (expenseCats[i]));
      context.fillStyle = colors[c];
      c++;
      context.fill();
      context.lineWidth = 2;
      context.strokeStyle = 'black';
      context.stroke();

      // Set label for expense category
      context.fillStyle = 'black';
      context.font = "14pt sans-serif";
      context.fillText(expenseCatsLabels[i], 620, globalVerticalAdjustment-10);

      if(i!=0){
        expenseCatVerticalAdjustment = (expenseCatVerticalAdjustment + expenseCats[i-1]);
        //for debugging only
        //alert("rev vertical adj = "+expenseCatVerticalAdjustment);
      }

      // Drawing top lines to connect with total revenue bar
      // Only difference is here is we are drawing the lines from right to left now, instead of left to right. This was done to keep the code
      // as consistent as possible
      context.beginPath();
      context.moveTo(620, (globalVerticalAdjustment));
      context.bezierCurveTo(600, expenseCatVerticalAdjustment, 440, expenseCatVerticalAdjustment, 440, expenseCatVerticalAdjustment);
      context.lineWidth = 1;
      context.strokeStyle = 'black';
      context.stroke();

      //drawing bottom lines to connect with total revenue bar
      context.beginPath();
      context.moveTo(620, (globalVerticalAdjustment+expenseCats[i]));
      context.bezierCurveTo(600, expenseCatVerticalAdjustment+expenseCats[i], 440, expenseCatVerticalAdjustment+expenseCats[i], 440, expenseCatVerticalAdjustment+expenseCats[i]);
      context.lineWidth = 1;
      context.strokeStyle = 'black';
      context.stroke();

      globalVerticalAdjustment += (expenseCats[i] + 50);

    }

    //resetting generic variables for location informatino
    globalVerticalAdjustment    = 30 + operatingIncome;
    expenseCatVerticalAdjustment  = 50 + operatingIncome + 30;
    c = 0;

    length = cosItems.length;

    //for debugging only
    //alert("expense category array has "+length+" items");

    for (var i = 0; i < length; i++) {
      //for debugging only
      //alert("global vert adj "+globalVerticalAdjustment);

      // Again, drawing rectangles in the exact same way as before, just different values
      context.beginPath();
      context.rect(820, globalVerticalAdjustment, 20, (cosItems[i]));
      context.fillStyle = colors[c];
      c++;
      context.fill();
      context.lineWidth = 2;
      context.strokeStyle = 'black';
      context.stroke();

      //set label for revenue source
      context.fillStyle = 'black';
      context.font = "14pt sans-serif";
      context.fillText(cosItemsLabels[i], 820, globalVerticalAdjustment-10);

      if(i!=0){
        expenseCatVerticalAdjustment = (expenseCatVerticalAdjustment + cosItems[i-1]);
        //for debugging only
        //alert("rev vertical adj = "+expenseCatVerticalAdjustment);
      }

      // Drawing top lines to connect with total revenue bar
      // As before with the expense categories, we draw the lines from right to left, this time aligning with the COS bar instead of
      // the total revenue bar. Also, to account for the variable height and location of the COS bar, we now use the expenseCatVerticalAdjustment
      // variable as the ceiling for the drawn lines.
      context.beginPath();
      context.moveTo(820, (globalVerticalAdjustment));
      context.bezierCurveTo(800, expenseCatVerticalAdjustment, 640, expenseCatVerticalAdjustment, 640, expenseCatVerticalAdjustment);
      context.lineWidth = 1;
      context.strokeStyle = 'black';
      context.stroke();

      // Drawing bottom lines to connect with total revenue bar
      // Same as above, except we now add the scaled value of cosItems[i] to expenseCatVerticalAdjustment to draw the bottom line
      context.beginPath();
      context.moveTo(820, (globalVerticalAdjustment+cosItems[i]));
      context.bezierCurveTo(800, expenseCatVerticalAdjustment+cosItems[i], 640, expenseCatVerticalAdjustment+cosItems[i], 640, expenseCatVerticalAdjustment+cosItems[i]);
      context.lineWidth = 1;
      context.strokeStyle = 'black';
      context.stroke();

      globalVerticalAdjustment += (cosItems[i] + 50);

    }

    // Begin scale section
    context.beginPath();
    // Here we draw a rectangle that is a scaled 10 units tall (relative to user inputs). The top of the scale rectangle will always be
    // 150 pixels below the total revenue bar
    context.rect(420, totalRevScaled+150, 20, 10*scaler);
    context.fillStyle = colors[c];
    c++;
    context.fill();
    context.lineWidth = 2;
    context.strokeStyle = 'black';
    context.stroke();

    //set label for scale
    context.fillStyle = 'black';
    context.font = "14pt sans-serif";
    // Set the scale label to line up with the scale rectangle
    context.fillText(scaleValue, 450, totalRevScaled+160);

    </script>
  </body>
</html>
It could still use some polish and pizzazz, but overall I'm pretty pleased with the tool. I've also learned with some time, math skills, and trial and error, you can draw just about anything in HTML5's canvas tag. If you are looking to build something using canvas, I'd highly recommend checking out HTML5 Canvas Tutorials. With almost zero knowledge of the canvas tag, I was able to knock out this project in just a few hours with the help of their tutorials.
As always, hope you enjoyed the post and let me know if you have any questions!
Leave a Comment